Inflation Schedule
Validator-clients have two functional roles in the Renec network:
- Validate (vote) the current global state of their observed PoH.
- Be elected as ‘leader’ on a stake-weighted round-robin schedule during which time they are responsible for collecting outstanding transactions and incorporating them into their observed PoH, thus updating the global state of the network and providing chain continuity.
Validator-client rewards for these services are to be distributed at the end of each Renec epoch. As previously discussed, compensation for validator-clients is provided via a commission charged on the protocol-based annual inflation rate dispersed in proportion to the stake-weight of each validator-node (see below) along with leader-claimed transaction fees available during each leader rotation. I.e. during the time a given validator-client is elected as leader, it has the opportunity to keep a portion of each transaction fee, less a protocol-specified amount that is destroyed (see Validation-client State Transaction Fees).
The effective protocol-based annual staking yield (%) per epoch received by validation-clients is to be a function of:
- the current global inflation rate, derived from the pre-determined dis-inflationary issuance schedule (see Validation-client Economics)
- the commission charged by the validation service,
- the up-time/participation [% of available slots that validator had opportunity to vote on] of a given validator over the previous epoch.
The first factor is a function of protocol parameters only (i.e. independent of validator behavior in a given epoch) and results in an inflation schedule designed to incentivize early participation, provide clear monetary stability and provide optimal security in the network.
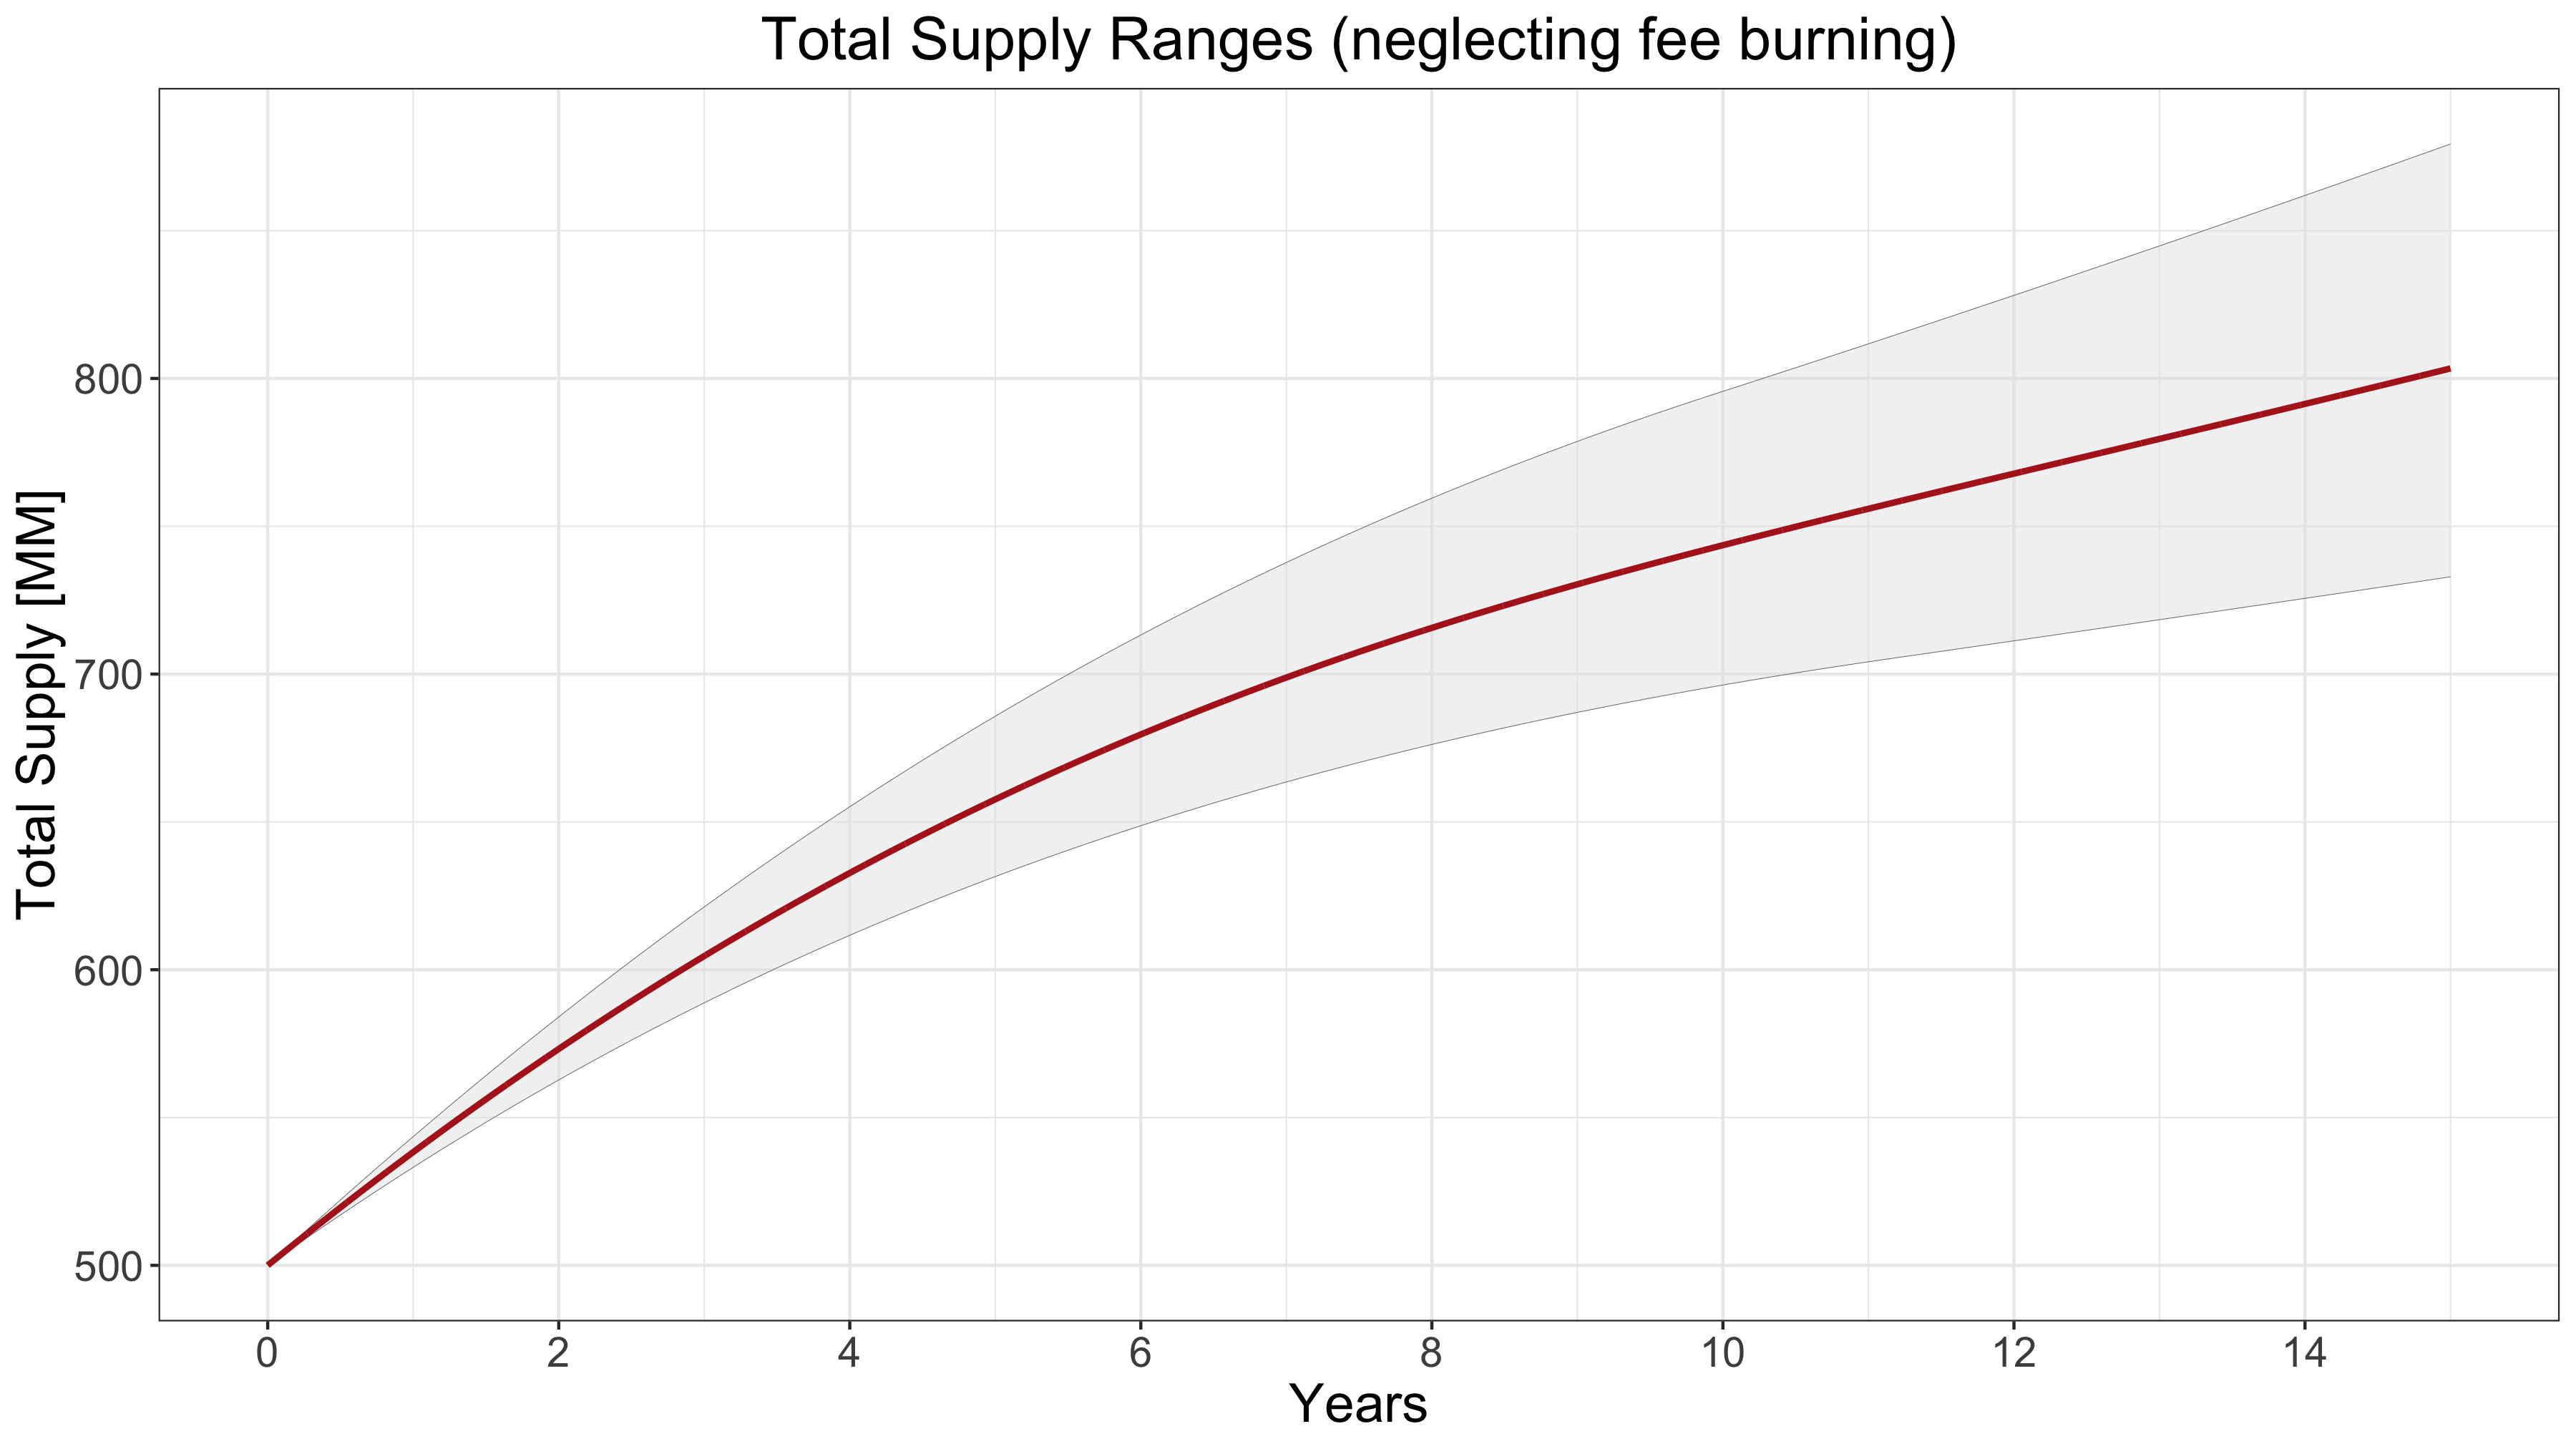
As a first step to understanding the impact of the Inflation Schedule on the Renec economy, we’ve simulated the upper and lower ranges of what token issuance over time might look like given the current ranges of Inflation Schedule parameters under study.
Specifically:
- Initial Inflation Rate: 7-9%
- Dis-inflation Rate: -14-16%
- Long-term Inflation Rate: 1-2%
Using these ranges to simulate a number of possible Inflation Schedules, we can explore inflation over time:
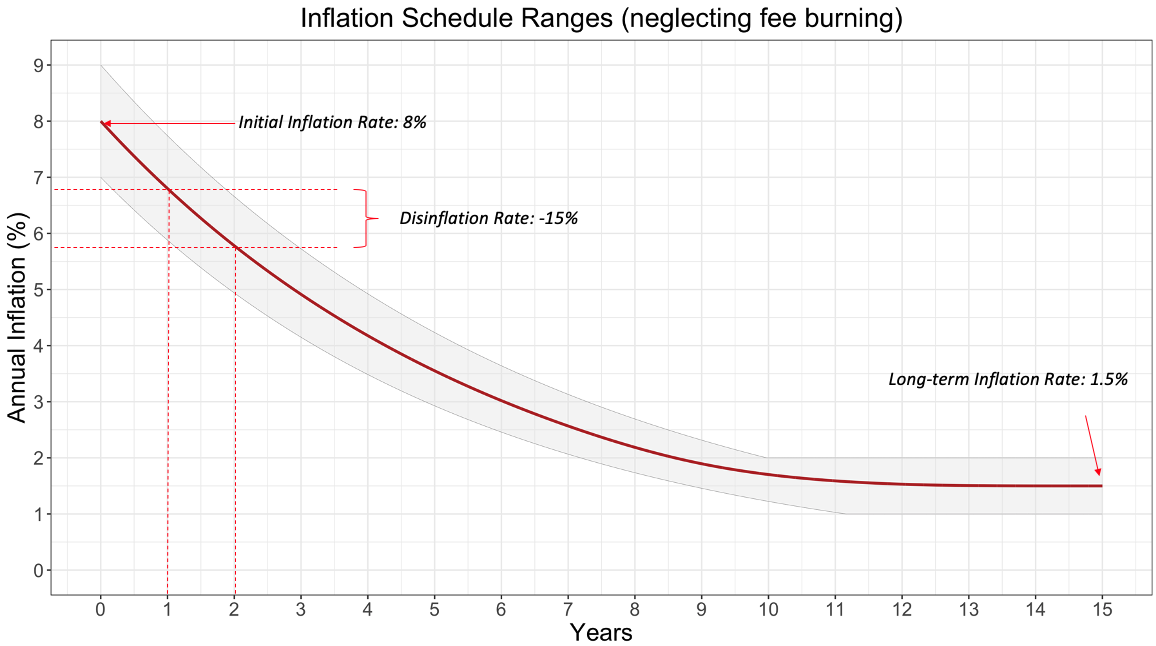
In the above graph, the average values of the range are identified to illustrate the contribution of each parameter. From these simulated Inflation Schedules, we can also project ranges for token issuance over time.
Finally we can estimate the Staked Yield on staked RENEC, if we introduce an additional parameter, previously discussed, % of Staked RENEC:
%~\text{RENEC Staked} = \frac{\text{Total RENEC Staked}}{\text{Total Current Supply}}
In this case, because % of Staked RENEC is a parameter that must be estimated (unlike the Inflation Schedule parameters), it is easier to use specific Inflation Schedule parameters and explore a range of % of Staked RENEC. For the below example, we’ve chosen the middle of the parameter ranges explored above:
- Initial Inflation Rate: 8%
- Dis-inflation Rate: -15%
- Long-term Inflation Rate: 1.5%
The values of % of Staked RENEC range from 60% - 90%, which we feel covers the likely range we expect to observe, based on feedback from the investor and validator communities as well as what is observed on comparable Proof-of-Stake protocols.
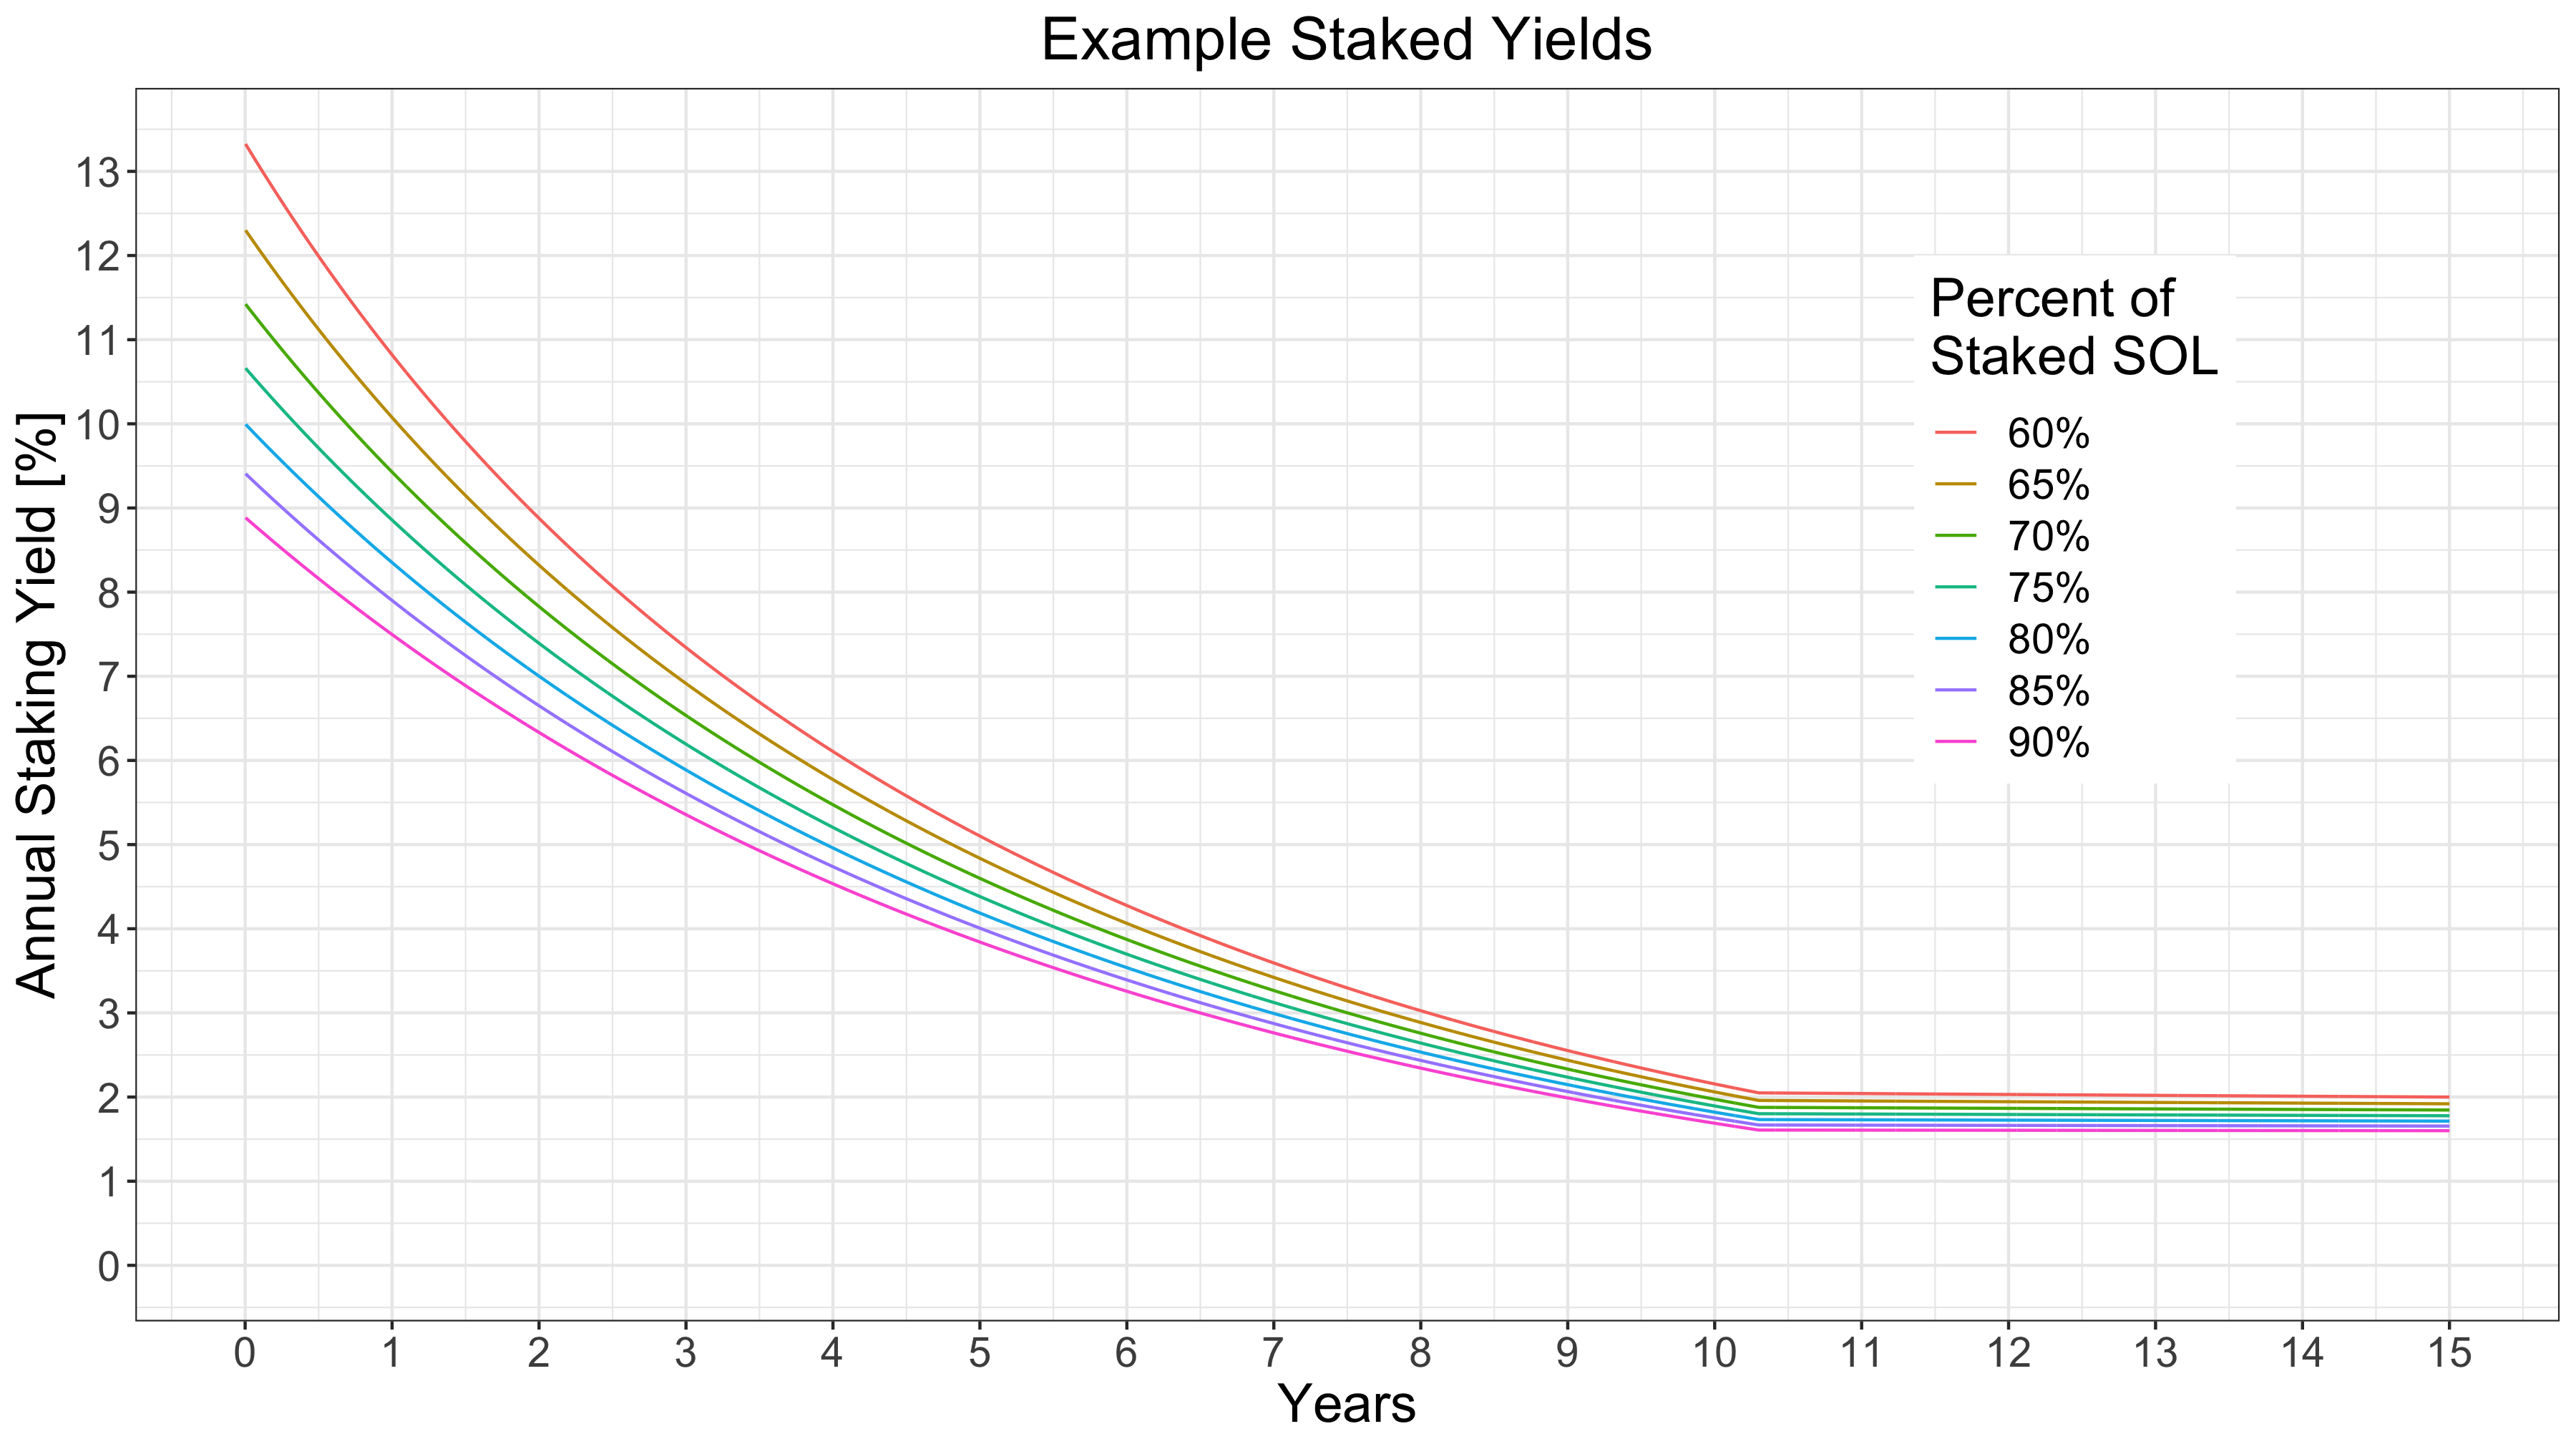
Again, the above shows an example Staked Yield that a staker might expect over time on the Renec network with the Inflation Schedule as specified. This is an idealized Staked Yield as it neglects validator uptime impact on rewards, validator commissions, potential yield throttling and potential slashing incidents. It additionally ignores that % of Staked RENEC is dynamic by design - the economic incentives set up by this Inflation Schedule.
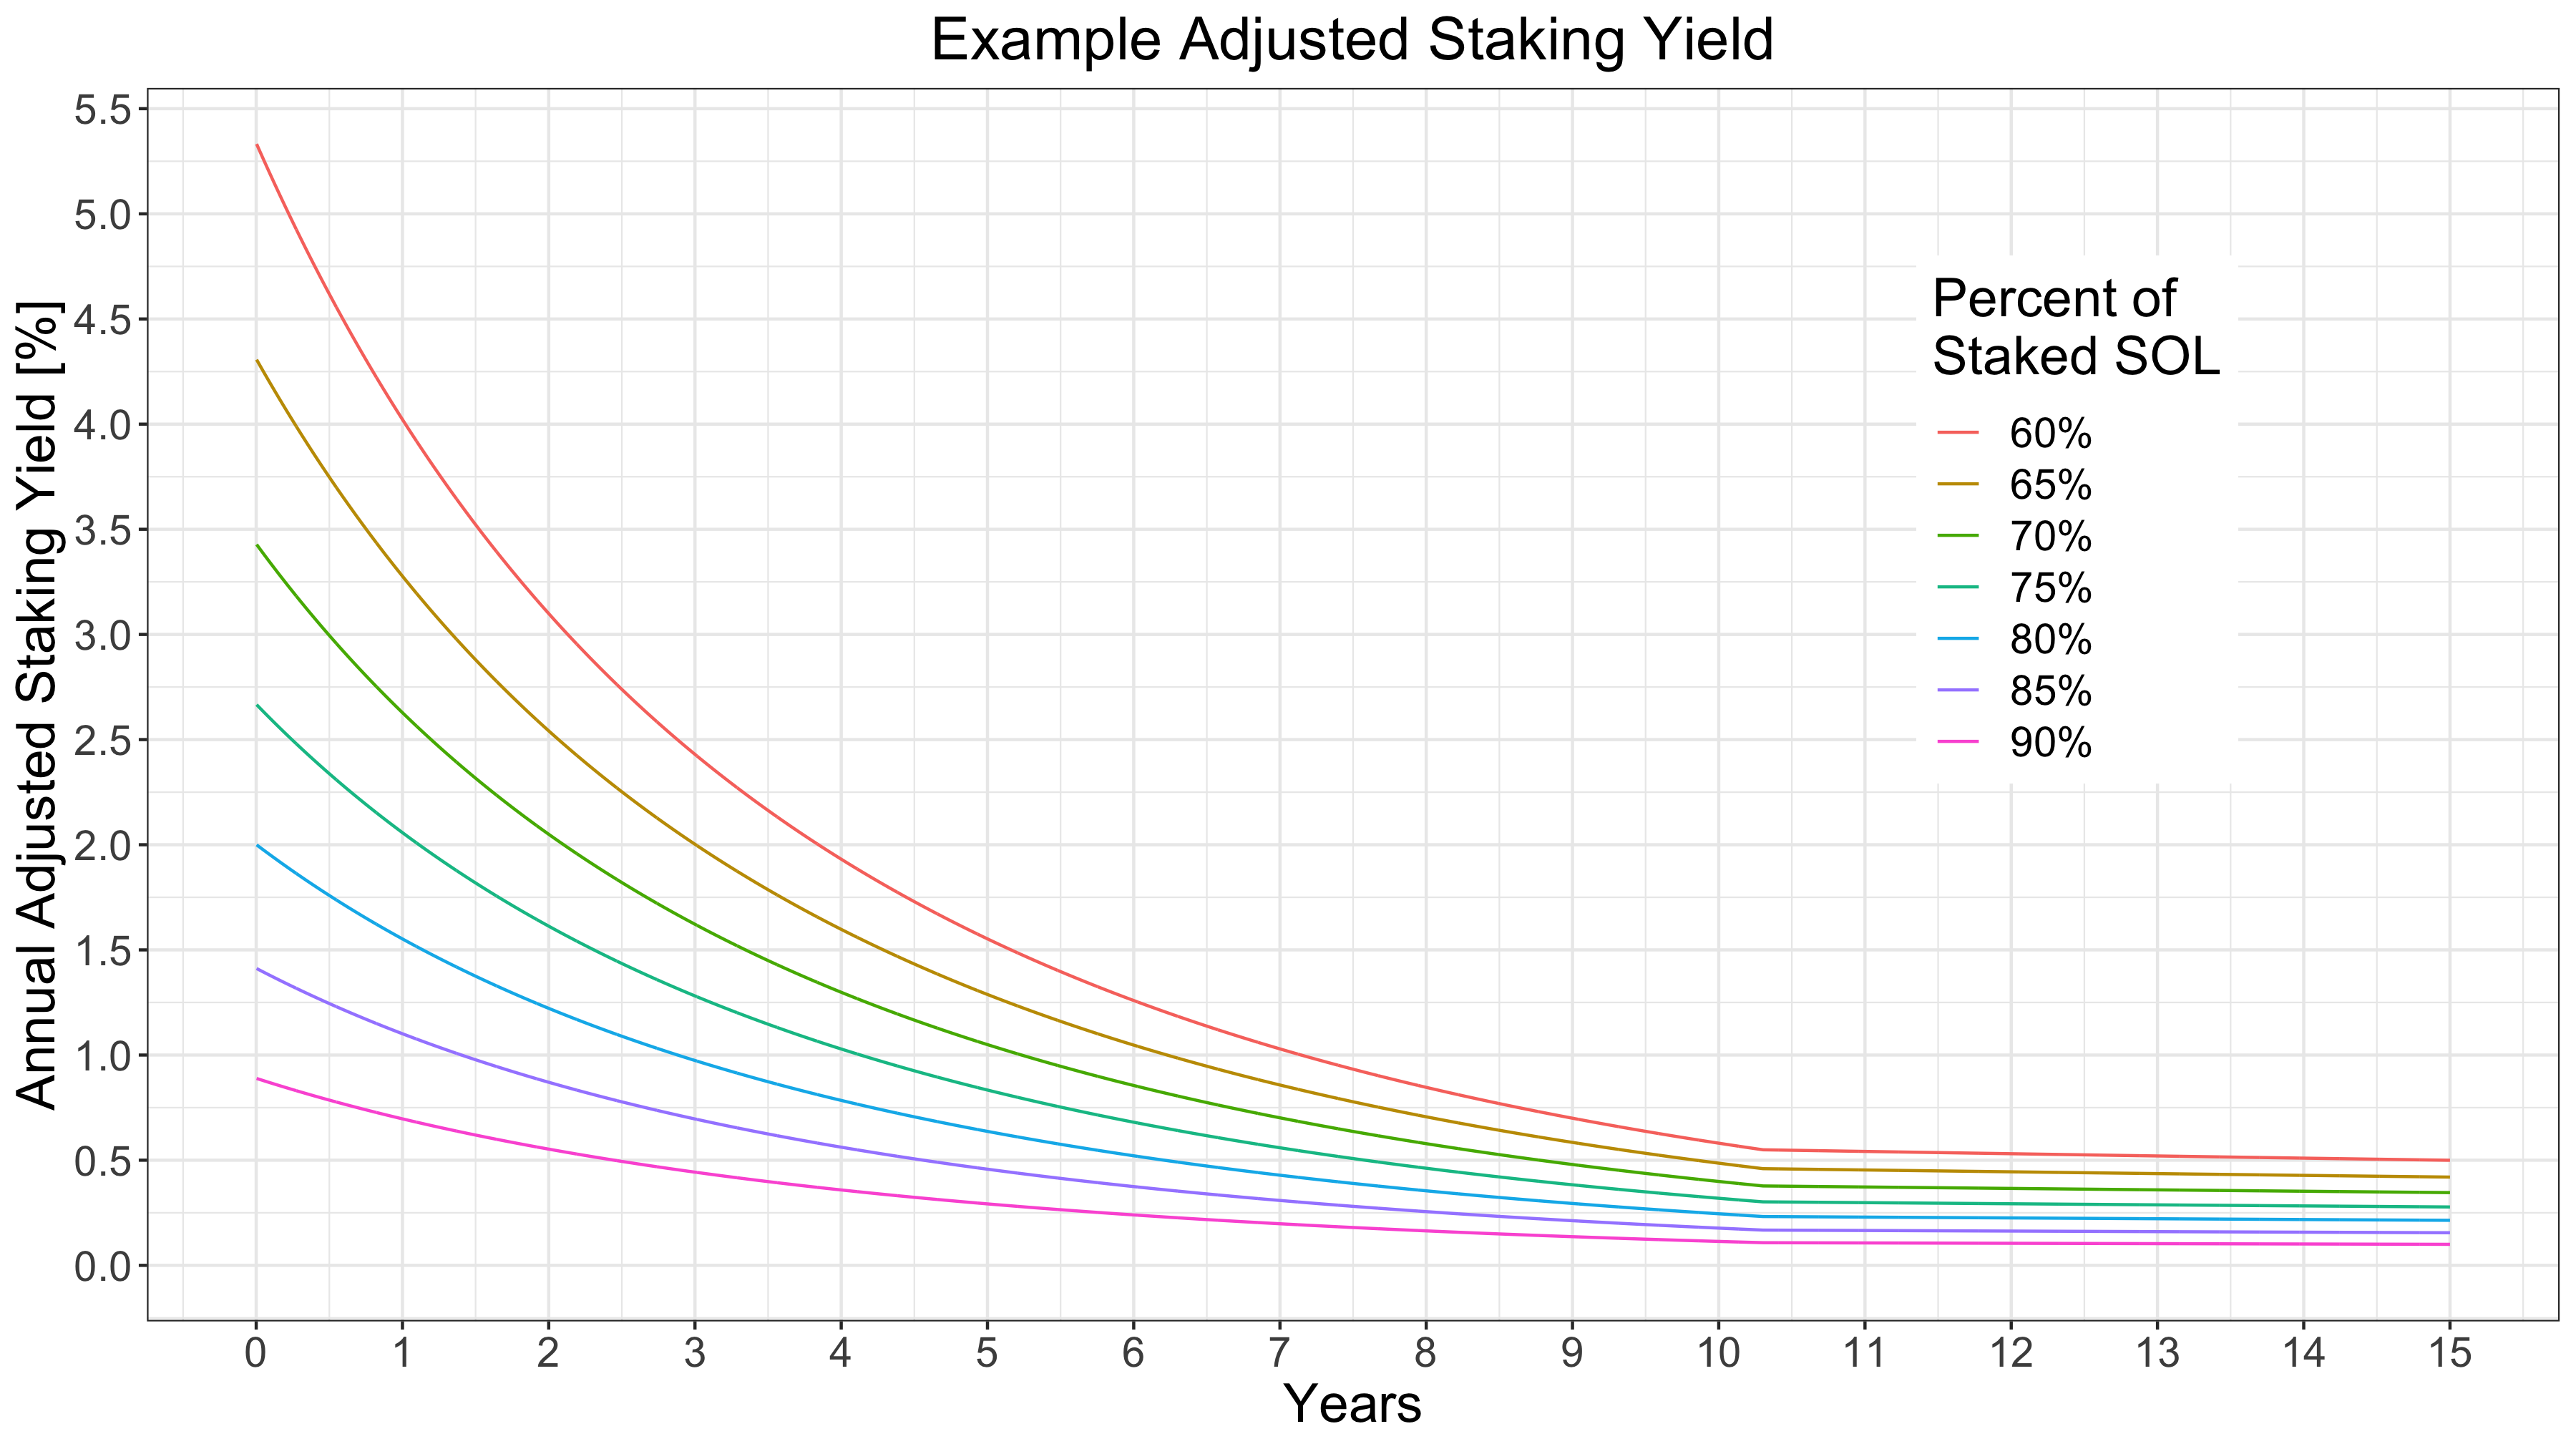
Adjusted Staking Yield#
A complete appraisal of earning potential from staking tokens should take into account staked Token Dilution and its impact on staking yield. For this, we define adjusted staking yield as the change in fractional token supply ownership of staked tokens due to the distribution of inflation issuance. I.e. the positive dilutive effects of inflation.
We can examine the adjusted staking yield as a function of the inflation rate and the percent of staked tokens on the network. We can see this plotted for various staking fractions here: